
Reading the My hosts dashboard
A field-by-field tour of the operator dashboard: stat cards, per-host list, status indicators, and what to monitor day-to-day.
in this article
The My hosts page in the YOM app is your control panel: every node you own, its current health, and what it’s earning. It packs a lot of information into a compact layout. This page walks through every field so you know what to monitor and when to worry.
the four stat cards at the top
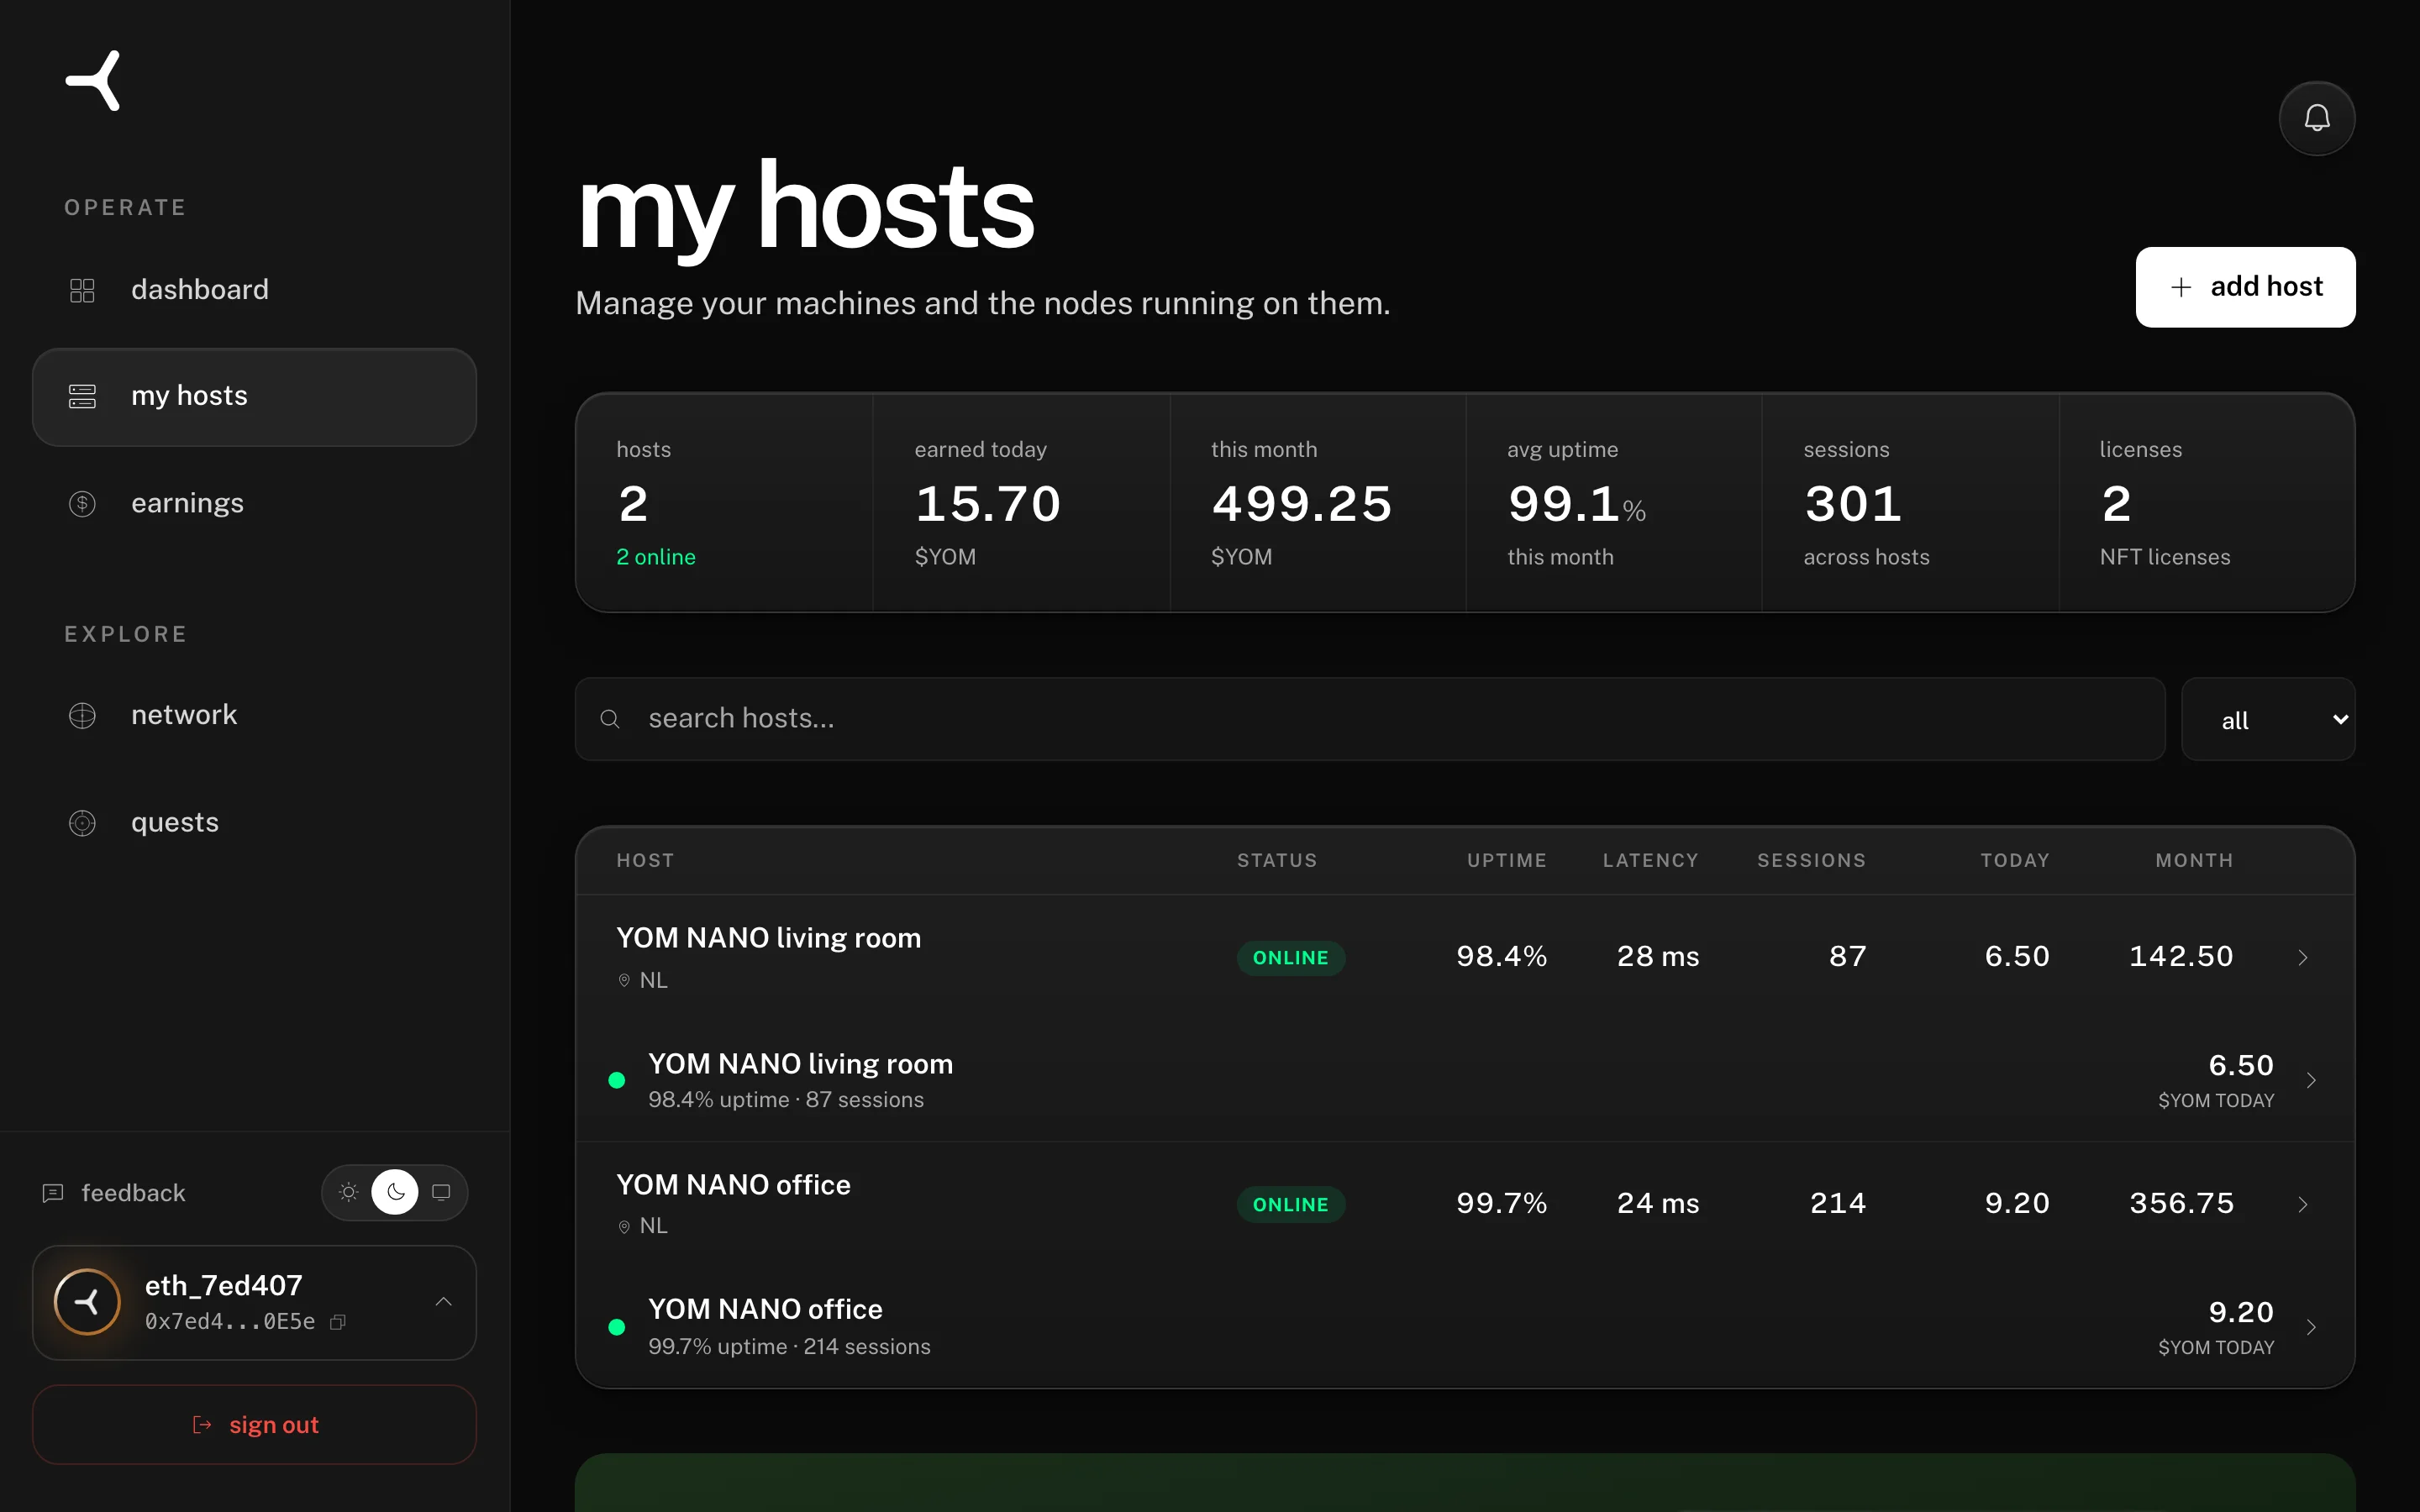
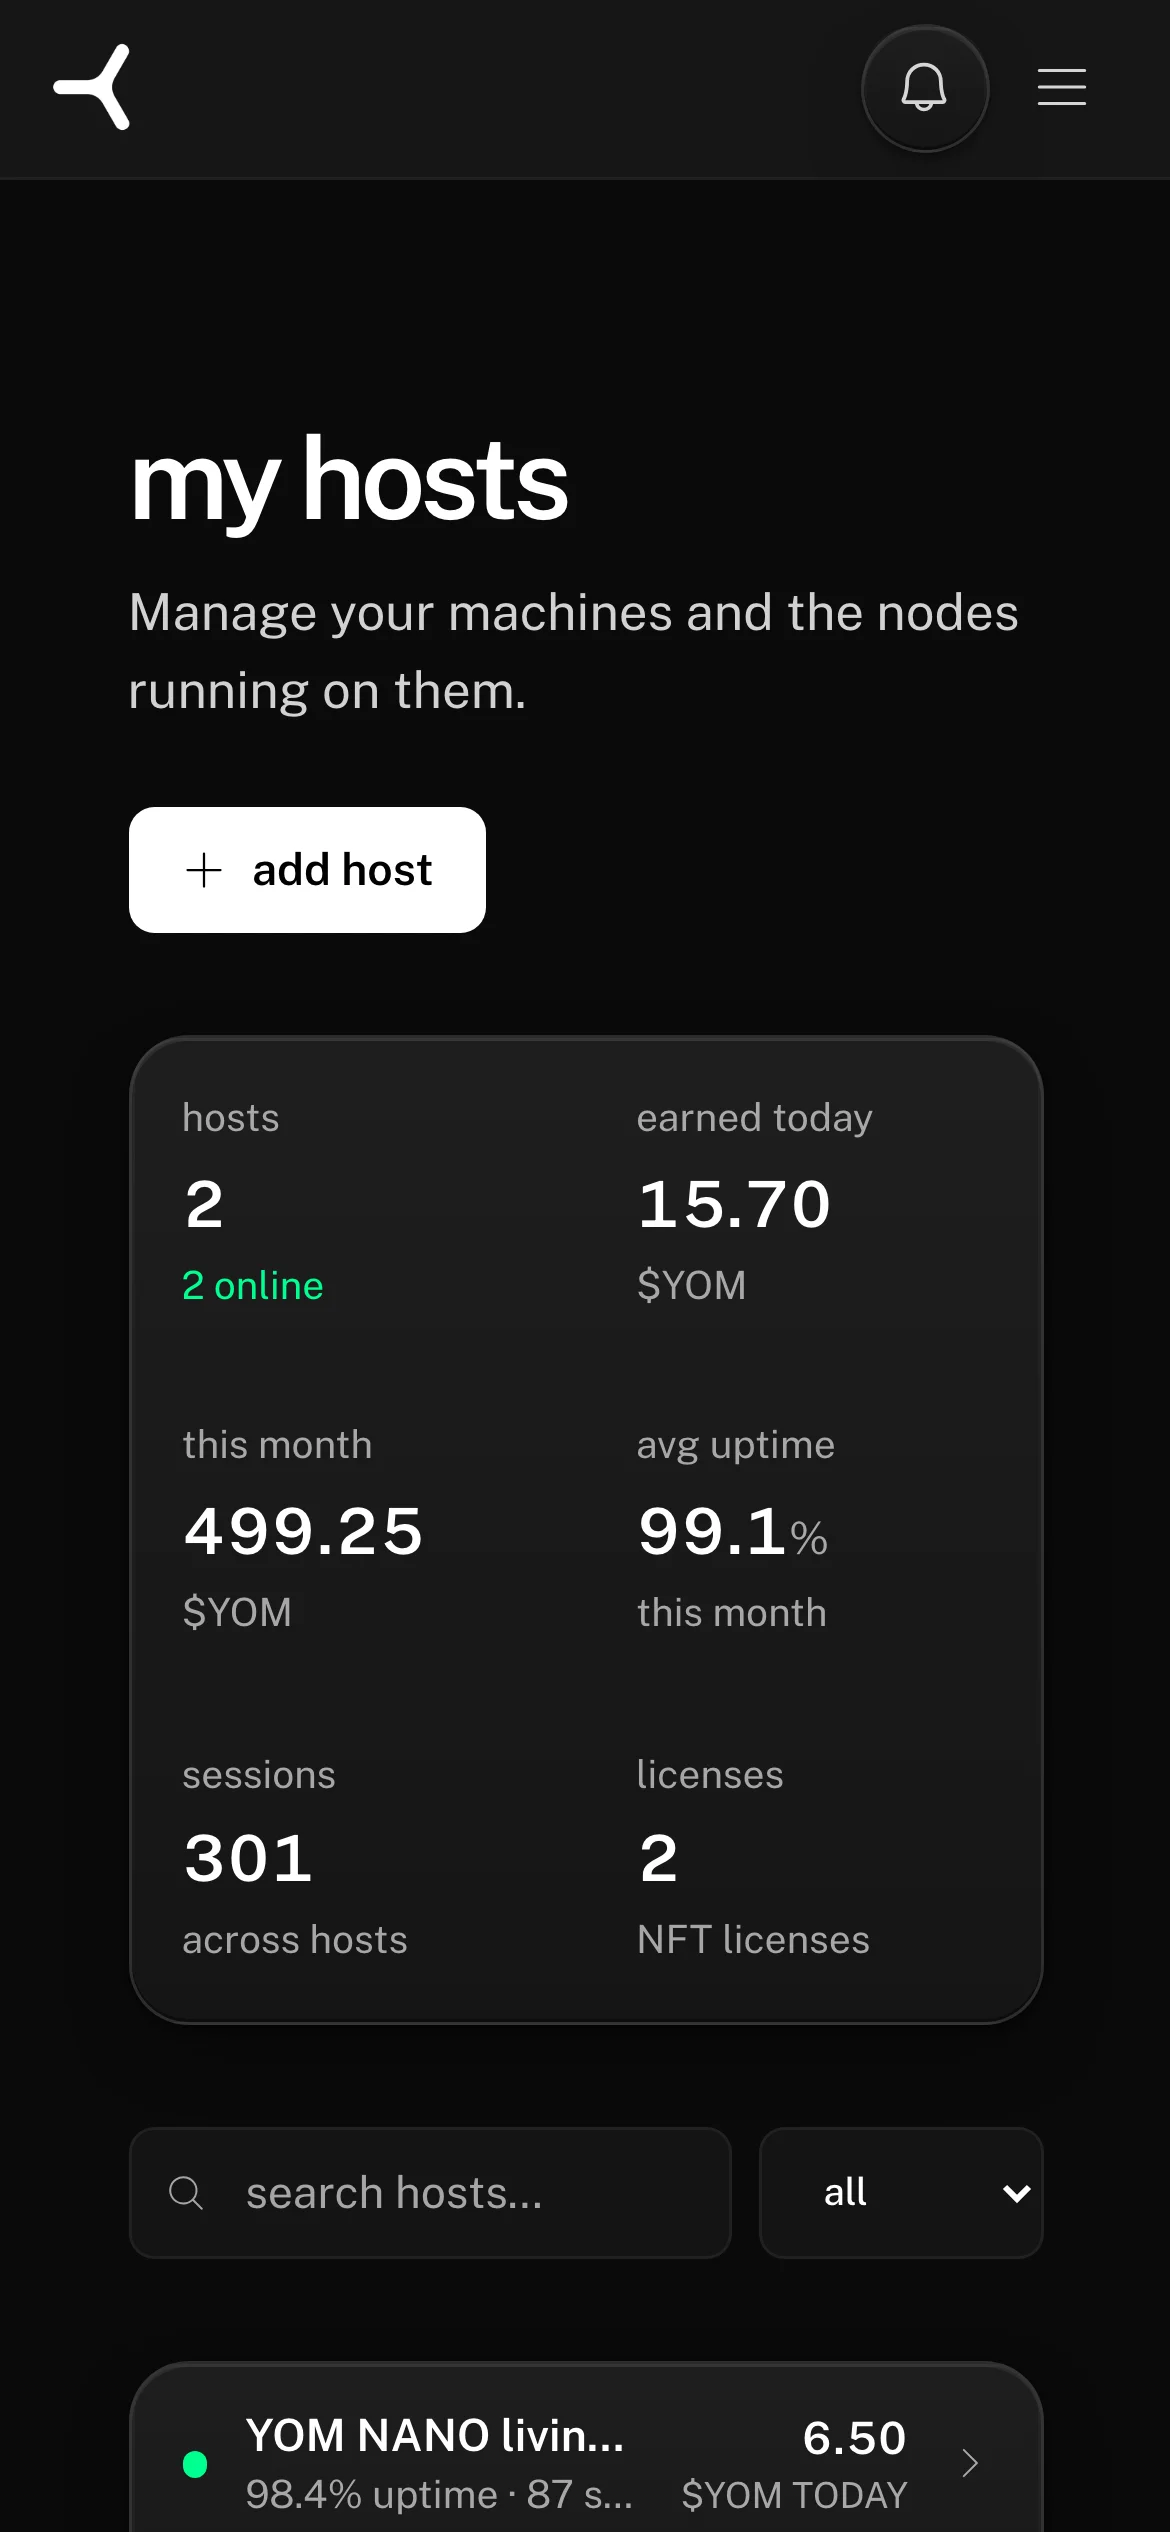
Across the top: a single-row summary of everything you own.
-
total hosts: how many NANOs are registered to this wallet. Counts deleted / archived hosts only if you toggle the filter.
-
status: format
X/Y all running(orX/Y · 1 offlineif any are down). The first number is active hosts, second is total. Click this card to filter the list to only the affected hosts. -
earned today: the sum of $YOM earned across all your hosts since 00:00 UTC. Resets daily, accumulates throughout the day.
-
avg uptime: a rolling 30-day average across all your hosts. Above 95% is healthy. If this drops below 80%, you have a chronic offline issue on one or more hosts.
This percentage is a health signal, not the earnings bar. It tells you whether the network can reach your node when the node says it is up. What qualifies you for the two monthly slots is a separate figure: 6 hours a day, averaged across the month, counted in real minutes online. See the NANO operator guide.
These are the numbers to glance at when you open the app each day. If anything looks off, drill into the per-host list below.
the search + filter row
Underneath the stat cards. Two controls:
- search hosts: type a host name (or part of it) to filter. Useful when you have 5+ hosts and want to jump to a specific one.
- all / online / offline / connecting: dropdown filter. Defaults to “all”. Use “offline” to see only problem hosts when you’re triaging.
the per-host list
Each host renders as a single row with six pieces of information. From left to right:
- Status dot + name: green (online), amber (connecting / degraded), grey (offline). Click anywhere on the row to open that host’s detail page.
- Region: 2-letter country code from the host’s IP. The network uses this to decide which players to route to you.
- Uptime: percentage of the current period the host has been online. Period default is “this month”.
- Latency: average round-trip from connected players to your node. Lower is better. Under 30 ms is excellent. Above 80 ms means players in your geo will see noticeable lag.
- Sessions: total streams this host has served in the current period.
- Licenses: format
X/Y. X is the number of licenses currently bound to this host, Y is the total licenses on your wallet.2/3means this host runs with 2 of your 3 owned licenses, leaving 1 unbound. - $YOM today: earnings from sessions on this specific host since 00:00 UTC.
Most metrics start at -- or 0 for the first hour or two after a node comes online. Once the network has run its first probes and routed a few sessions, real numbers appear.
what the status indicator means in practice
- green (online): the node has reported a heartbeat in the last 60 seconds and the network considers it routable. Players in your region can be sent to it right now.
- amber (connecting / degraded): the node is reachable but something is iffy. Maybe its first hardware-detection is still completing, maybe its latency just spiked above the safe threshold. Most amber states clear within a few minutes.
- grey (offline): no heartbeat in over 60 seconds. The network has stopped routing to this host. If it stays grey for more than 5 minutes, check the node offline troubleshooter.
when to drill into the detail page
Click any host row to open its detail page. You want to do that when:
- A specific host is offline and you need to see what changed
- You want the live GPU / CPU / RAM telemetry to debug performance
- You want to see the session-by-session log for that host
- You want to check or bind licenses
The detail page has more granular charts (uptime over time, latency over time, session breakdown by game) that the list view summarizes.
what to monitor day-to-day
You don’t need to babysit this page. A healthy setup means:
- All hosts green
- Avg uptime ≥95% over rolling 30 days
- “Earned today” trending upward in the evening (when local players are most active)
If those three are true, your nodes are doing their job. Anything else triggers a dive into either the host detail page or the troubleshooting articles.
Can't sign in, or don't have an account yet? Email support@yom.net
11 / 14 operating a YOM node
all articles