
The host detail page explained
A field-by-field tour of a single host's detail page: status header, uptime, telemetry, latency, and the host configuration card.
in this article
Click any host row on the My hosts dashboard and you land on that host’s detail page. Where the dashboard summarizes every node you own in one row each, the detail page is the deep view for a single machine: its live status, its charts, its detected hardware, and its configuration. This is the page you open when something looks off. It’s also the place to confirm a new node is behaving.
Here’s the full page at a glance:
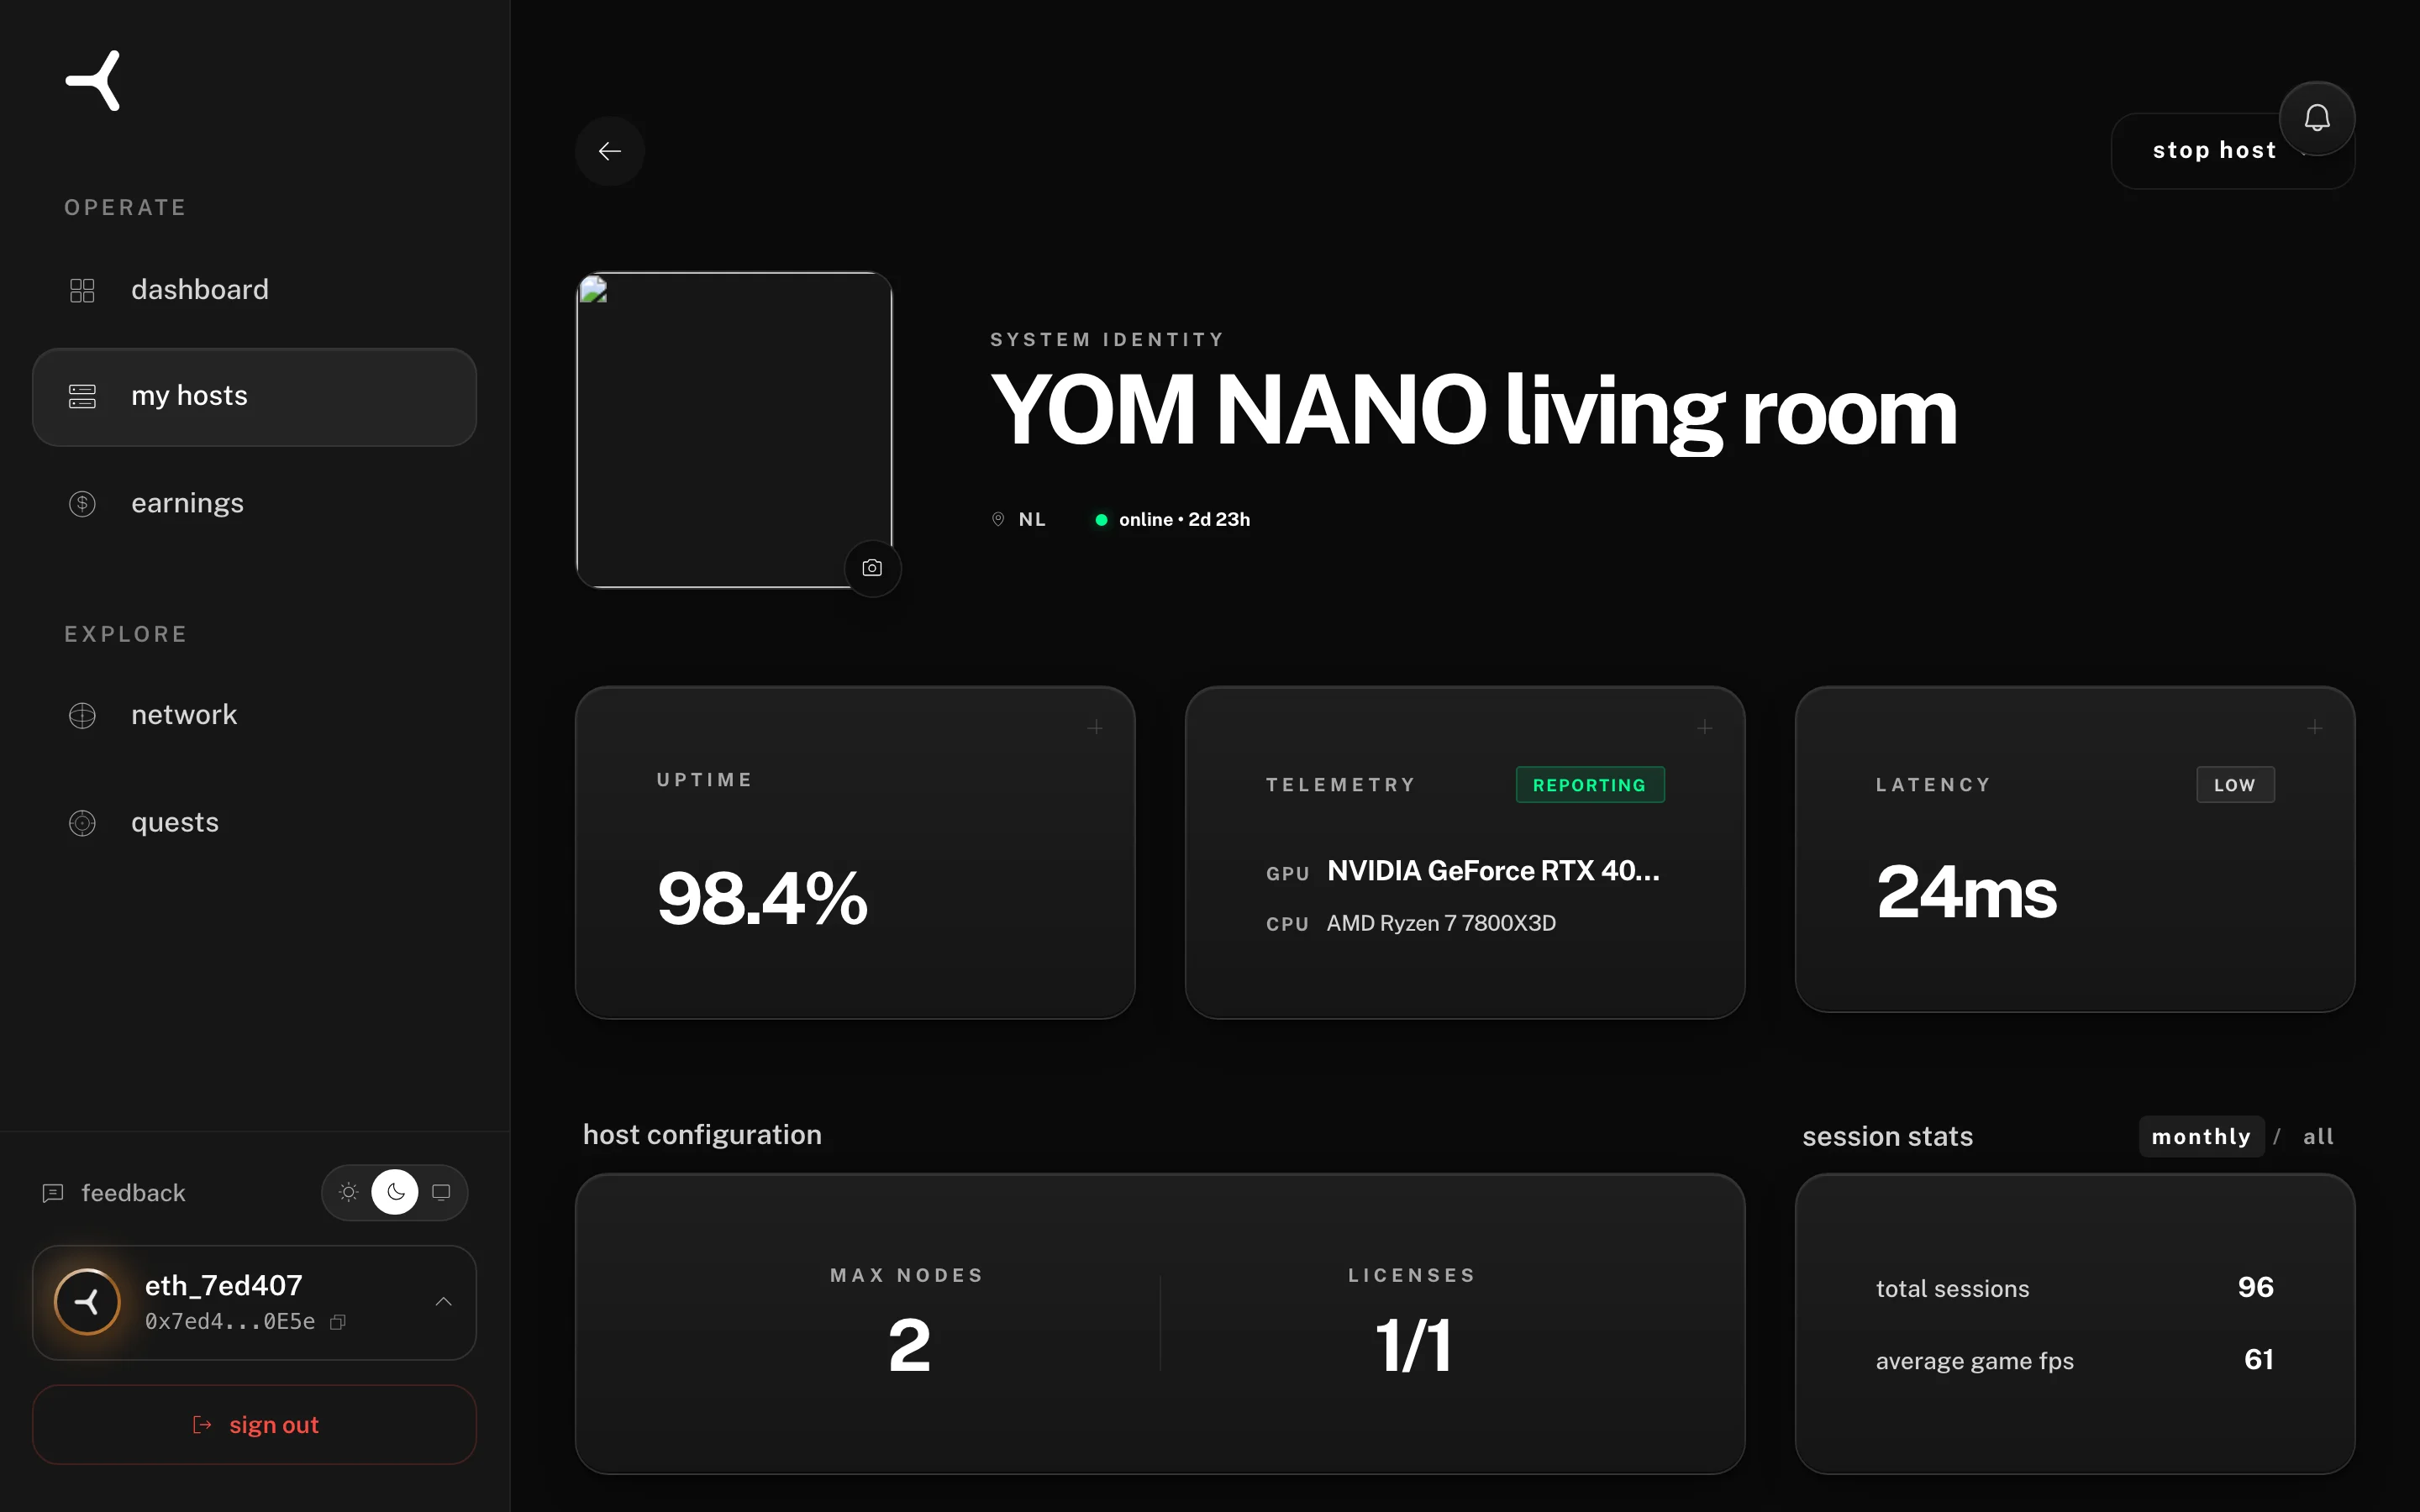
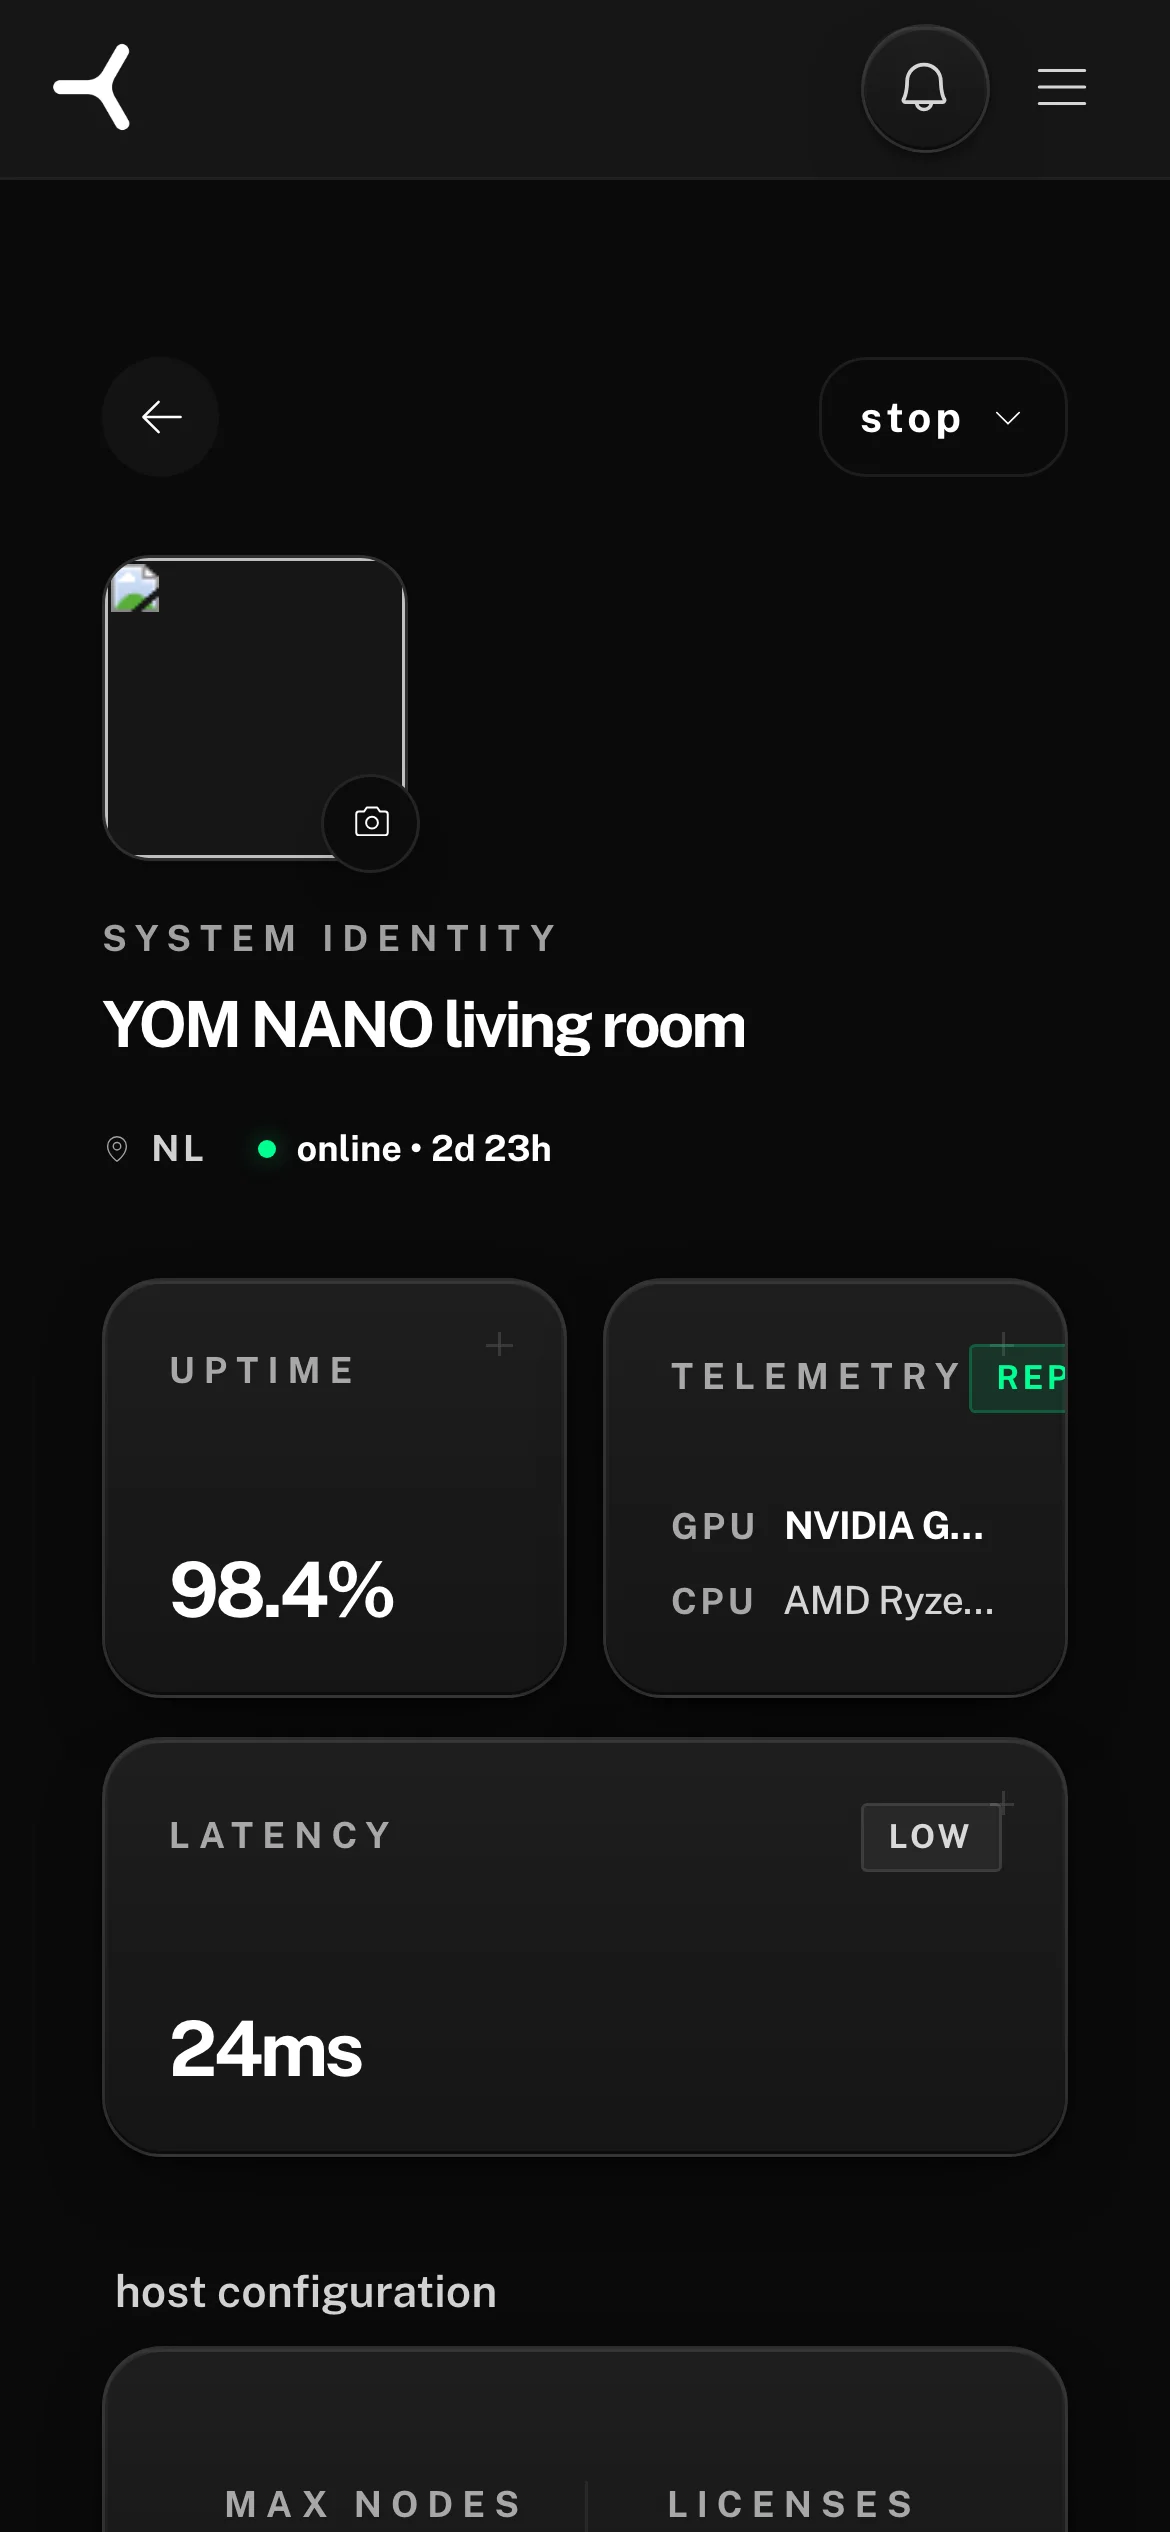
Let’s walk through it card by card.
the header: status and name
The top of the page identifies which host you’re looking at (the name you gave it during registration) and its current status. The status here means the same thing as the dot on the dashboard list:
- online: the node reported a heartbeat within the last 60 seconds and the network is routing players to it
- connecting / degraded: reachable, but something is settling. Usually clears within a few minutes
- offline: no heartbeat in over 60 seconds; the network has stopped routing to this host
If the status is anything other than online for more than a few minutes, jump to the node offline troubleshooter before digging through the rest of the page.
the uptime card
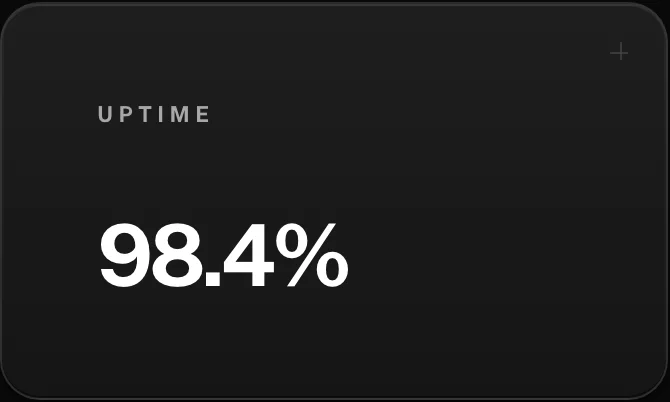
Uptime is the percentage of the current period this host has been reachable. On a freshly claimed node it starts at 0% and climbs as the machine accumulates online time, so don’t panic at a low number in the first hours.
For an established host, the benchmark is the same one the dashboard uses: 95% or higher is healthy.
This percentage is a health signal, not the earnings bar. It tells you whether the network can reach your node when the node says it is up. What qualifies you for the two monthly slots is a separate figure: 6 hours a day, averaged across the month, counted in real minutes online. See the NANO operator guide. A host that consistently sits below that is going offline regularly. The usual suspects: a PC that gets shut down, a flaky network connection, or a machine that sleeps. The detail page’s uptime view is where you spot when the drops happen, which is the first clue to why.
the telemetry card
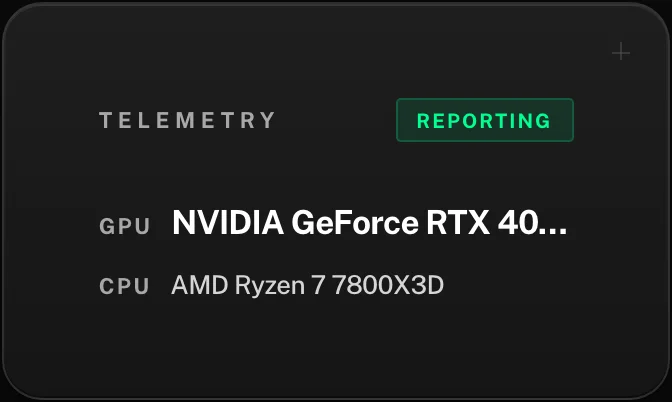
Telemetry is what your node reports about its own hardware. The card shows the detected GPU and CPU, the two components the network uses to decide what your machine can handle.
Two things to check here:
- Is the hardware detected at all? Right after a node comes online, detection can take a few minutes. If the GPU or CPU still shows
unknownwell after the node is online, hardware detection is stuck. Most often that’s a GPU driver compatibility issue. - Is it the hardware you expected? If you upgraded your GPU and the card still shows the old one, the node hasn’t re-detected yet.
the latency card
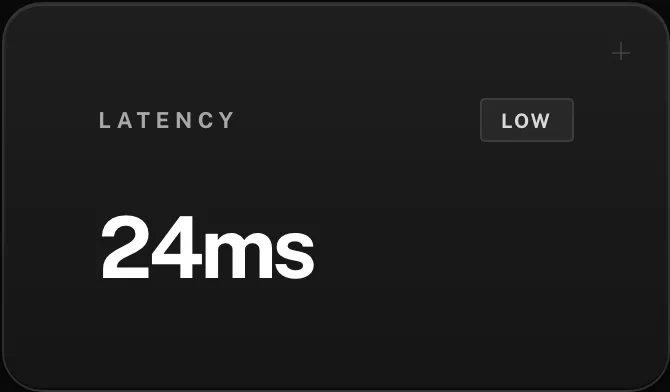
Latency is the average round-trip time from connected players to your node. It starts at 0ms on a new host while the network is still probing routes, then settles to a real average once sessions flow through.
The thresholds match the dashboard:
- Under 30 ms is excellent: players near you get a snappy stream
- Above 80 ms means players in your geo will see noticeable lag
Latency is mostly determined by your physical location and connection quality, not your hardware. If it creeps up over time, look at your network first: wired ethernet, no VPN, no bandwidth-hungry devices sharing the line.
the host configuration card
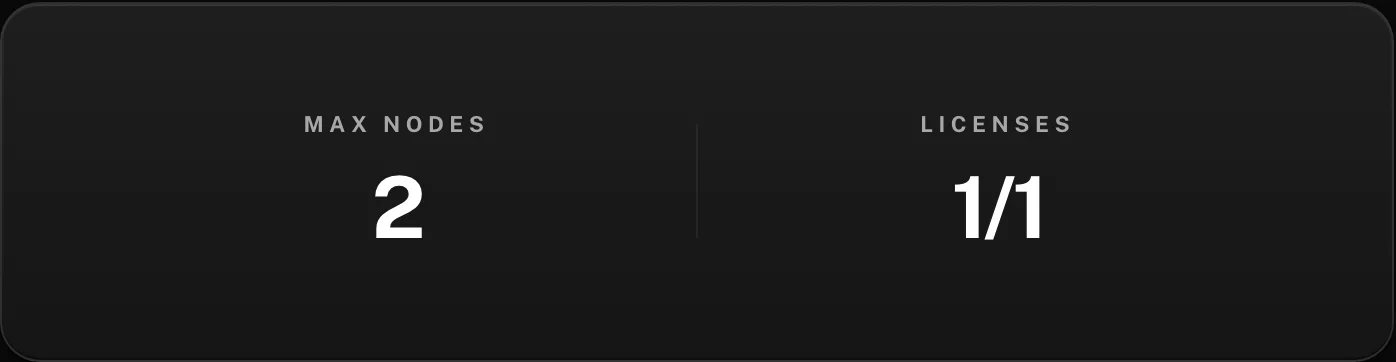
Configuration is about what this host is allowed to do, rather than what it’s currently doing:
- max nodes: the number of concurrent sessions your hardware can host, determined by the rig check based on GPU VRAM and CPU headroom. A
2means two players can stream from this machine at the same time. - licenses: how many of your owned node licenses are bound to this host, in
X/Yformat.1/1means one license, fully bound. If you own spare licenses, this is where you bind extras to raise capacity. You can also leave them free for a second host.
how this page fits your routine
Day to day, the dashboard is enough: all hosts green, average uptime at 95% or better, earnings ticking up. Open the detail page when a specific host needs attention: an offline status, an uptime dip you want to time-box, a latency number that drifted, or a hardware change you want to verify in telemetry. And if the host won’t come back online, the node offline guide is the next stop.
Can't sign in, or don't have an account yet? Email support@yom.net
12 / 14 operating a YOM node
all articles